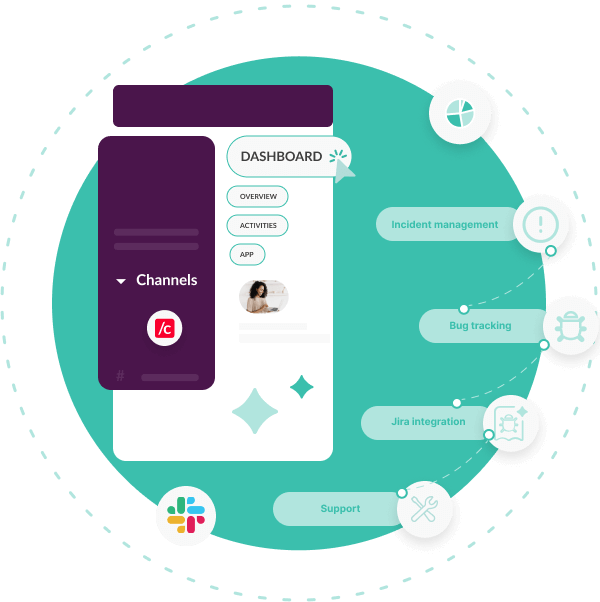
Incident insights from the Dashboard
The Insights section is found in the Dashboard, our web-based UI.
The data-rich visualizations give you the most important metrics for your incident management,
bug tracking, Jira and support tickets. Provide information to key stakeholders and identify
where you can boost efficiency.
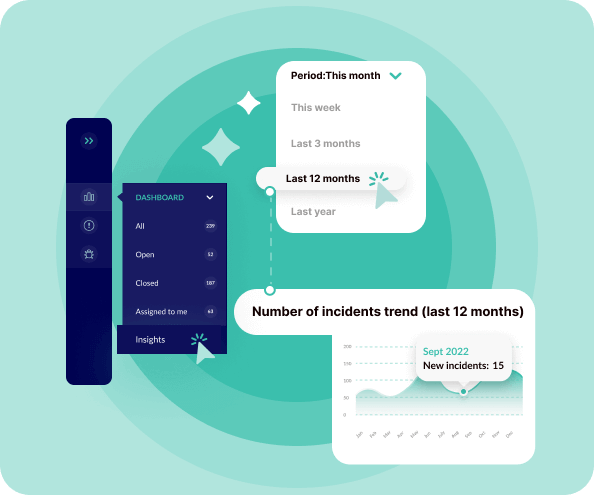
Identify important trends over time
Filter your incidents and activities weekly, monthly, quarterly or yearly.
No matter what filter you apply, at the top of each section you will see a fixed
12-month period (e.g. Number of activities trend), to help identify patterns as trends over time.
Stability and site reliability for engineers
Use incident insights to create a picture about the stability and reliability of software or
services with key MTTX data. Under Insights, you will find useful data on the Number of incidents
created, a breakdown of incidents by severity levels, Mean Time to Respond and
Mean Time to Resolve.
Optimize your processes and build best practices
Insights provide you with important data on incident or activity response and resolution times. This is especially important for developers and engineers working to optimize systems and build best practices.
Insights are valuable for managing the overall performance and efficiency of teams. By monitoring and analyzing key metrics, teams can take steps to streamline their incident response processes.

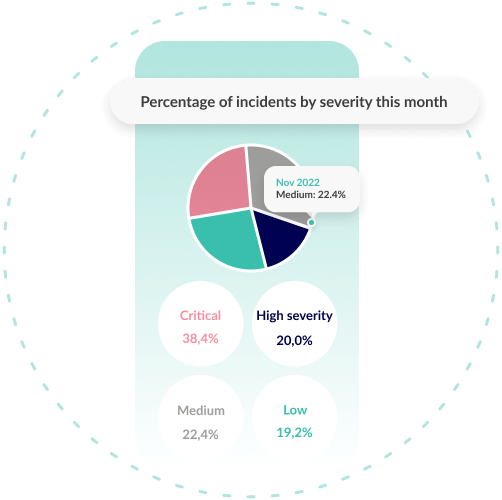
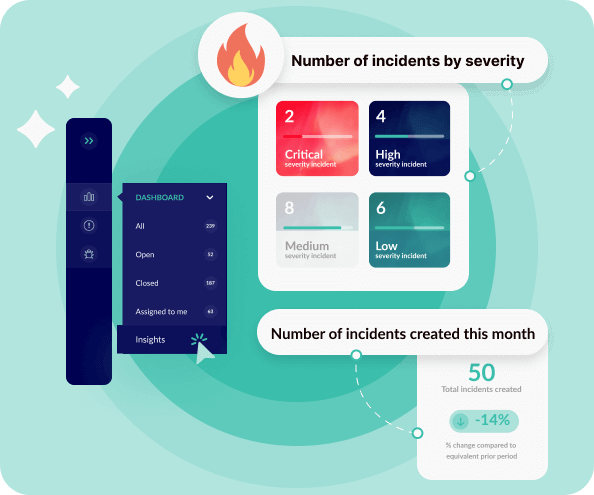
Number of incidents by severity
Get an overview of the number of activities that have been created in the time
period you’re filtering for. See a percentage breakdown based on severity for the
time period shown, as well as the 12-month trend.
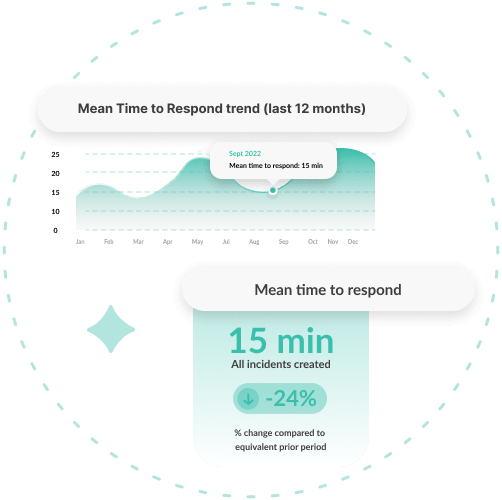
Mean Time to Respond
Perhaps one of the most important metrics in incident management, Mean Time to Respond
is useful for detecting patterns that enable you to shorten response time.
From the Insights section, this is shown by severity level and also expressed as a
percentage of change compared to the equivalent prior time period.
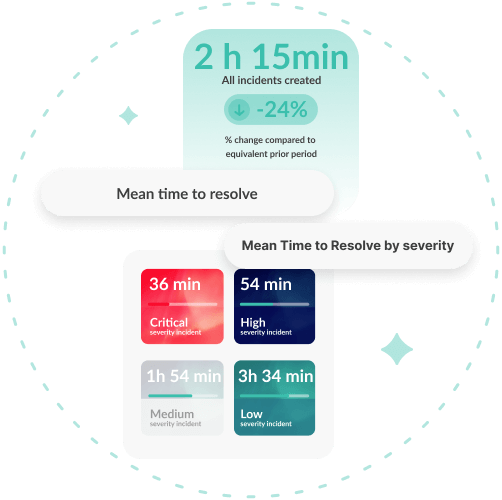
Mean Time to Resolve
The Mean Time to Resolve is the average time to resolve, or conclude an incident.
Here you can evaluate the efficiency of your incident management processes which can
impact productivity and cost savings. This section is expressed as a percentage of
change compared to the equivalent prior period, also includes the severity level.